
Quantitative Data Classification
- Data Classification: lab4dataclass
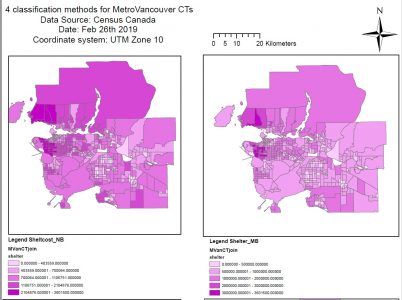
Natural Break Manual Breaks
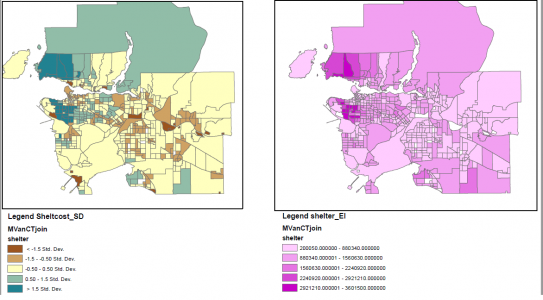
Standard Deviation Equal Interval
Natural breaks: Natural breaks are based on Jenks algorithm, where the breaks minimize the average deviation from the class meanwhile maximizing the deviation from the means of the other classes. Natural breaks are not useful in comparing multiple maps because it depends on each map with different underlying information.
Equal interval is when the data is pooled into equal amounts within each break in the dataset. This is a naïve approach in classifying data as this will be visually deceptive and will not represent any important trends. This classification also does not start at zero, so it shows some regions to be affordable, where in actuality these regions are being misrepresented.
Standard deviation tells us how much a feature’s attribute value varies from the mean.
Manual breaks: When we manually add class breaks and set class ranges to compare different maps with. With manual brakes, we can customize the class ranges to fit the map you are comparing with, which is Montreal vs Vancouver in our case.
- Data Uncertainty
Data suppression will occur if areas surveyed have a population value that falls under a specified amount. For example, if an area surveyed has less than 40 persons, this data will be removed. Data suppression can also occur if there is poor quality data such as many outliers or technical issues. Random rounding is used to prevent individuals from being identified from within the tabulations and If any DAs have zeros for in their data that indicates that there was no data available.
- Cost of Housing
Cost of Shelter: housecostVM
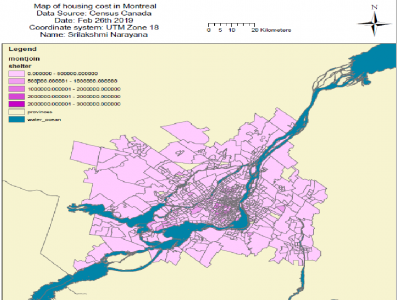
The above map is the cost of housing in Montreal, the source of data is from Census Canada. According to Statistics Canada, shelter cost refers to the average monthly total of all shelter expenses paid by households, but it doesn’t indicate if the household is able to afford the shelter cost. Another issue with using shelter cost is that it excludes private households living in band housing or located on an agricultural operation that is operated by a member of the household. The population of the study should be specified, whereas this map covers all of Montreal, and we don’t have knowledge on which are private households.
Housing affordability: affordability
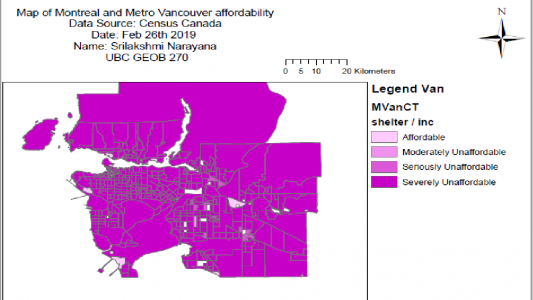
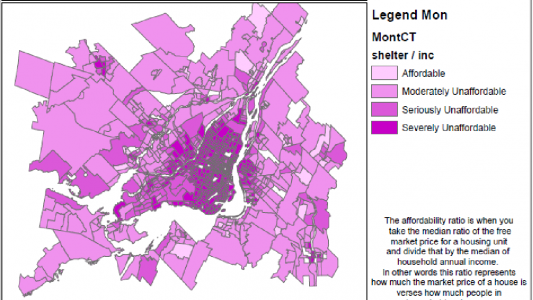
The affordability ratio, the median price of the free market for a housing unit is divided by the median household annual income. In other words, this ratio represents how much the market price of a house is versus how much the person’s annual income will allow a person to buy, this is a better indicator for housing affordability because it gives you an estimate on how much a family can afford in a given area.
Housing affordability rating categories
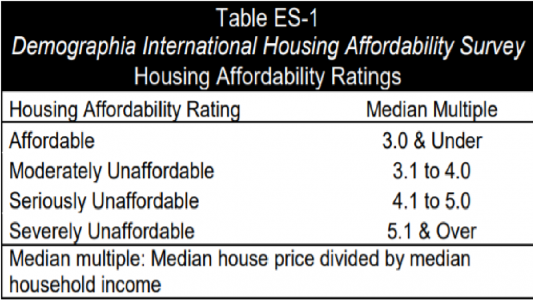
This ratio was determined by Alain Bertaud, and yes this is a trusted way of analyzing the affordability of a region. The median multiple is used for evaluating urban markets and has been recommended by the World Bank and the United Nations and is used by the Joint Center for Housing Studies, Harvard University. This ratio can be applicable to any part of the world as it takes into consideration the housing market for the region that is being analyzed and the individual’s income
The livability Index measures the quality of life in American communities across multiple dimensions: housing, transportation, neighborhood characteristics, environment, health, etc. Vancouver has been ranked to be one of the most livable cities in the world, but as you see in the maps able the most unaffordable, thus affordability a not a good indicator of a city’s ‘livability’.
Classification of data and learning how each classification method influences the data presented was a significant learning curve during this lab.