During lab 3 we analyzed the effects of flooding during a storm surge. We created 4 maps, map 1 focused on examining the topography of the land to determine the areas of low elevation where the greatest risk of flooding is prominent. Map 2 displays the extent of flooding 1 km inland, and map 3 shows all the roads that are within this 1km flooding zone. Finally, map 4 shows the new location of St Paul's Hospital and we can use this to examine how the hospital might be affected if a storm surge were to occur.
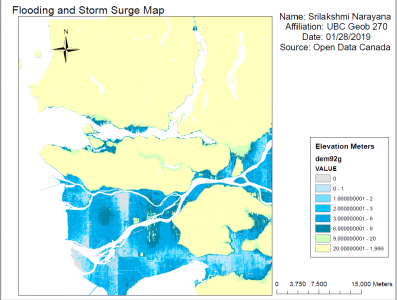
All these maps give us an estimated idea on which areas could be affected if we had a storm surge. The DEM resolution is 25, 25m, we cannot assume that this data is up to date since there are always new developments around cities every year. The inbuilt algorithm in GIS software can also interpolate elevation values at various points to get a continuous surface/raster, so there might be errors also present in our maps.
MAP 1 lab3_lowelevleg
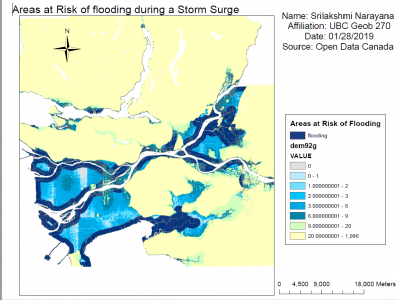
MAP 2 lab3_flooding
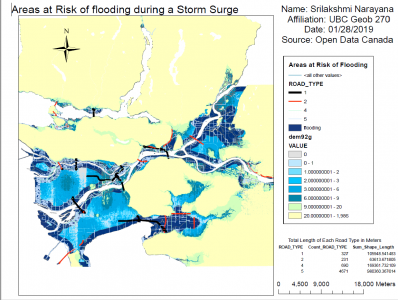
MAP3 lab3_roadsflood
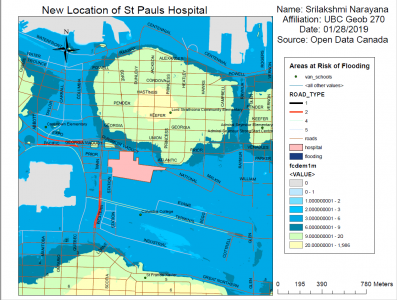
MAP4 lab3_falsecreek
Creating these maps using GIS software has allowed to me navigate through the different tools available for spatial analysis especially the editor tool where I can access the polygon feature to highlight important parts of the map.